Advertisement

Graphing Drills
This section includes numerous online and printable drill activities related to graphing. Use the filters on the left side of the page to isolate activities by grade level or format (printable or online).

Introduction to Bar Graphs - Online
Description: This activity requires students to read basic bar graphs. Immediate feedback is given.

Bar Graphs as Pictures - Online
Description: This activity requires students to read and make calculations based on a bar graphs with y-axis intervals of two or more. Immediate feedback is provided.

Reading a Basic Bar Graph
Description: This activity requires students to answer questions about a basic bar graph.

Bar Graph Practice: Favorite Ice Cream Flavor - Online
Description: This online activity requires students to analyze a bar graph that measures favorite ice cream flavors and to answer eight multiple choice questions. Immediate feedback is given.

Bar Graph Practice: Favorite Ice Cream Flavor
Description: This online printable requires students to analyze a bar graph that measures favorite ice cream flavors and to answer eight multiple choice questions.

Bar Graph Practice: Favorite Ice Cream Flavor
Description: This online activity requires students to analyze a bar graph that measures favorite ice cream flavors and to answer eight multiple choice questions.

1.MD.C.4 Grade 1 Common Core - Reading a Tally Chart
Description: This activity requires students to read a tally chart and answer questions about it.

1.MD.C.4 Grade 1 Common Core - Reading a Tally Chart - Version 2
Description: This activity requires students to read a tally chart and answer questions about it.

Using a Tally Chart to Record Favorite Video Games
Description: This activity requires students to use a tally chart to record the favorite video games of classmates and to convert the data to a bar graph.
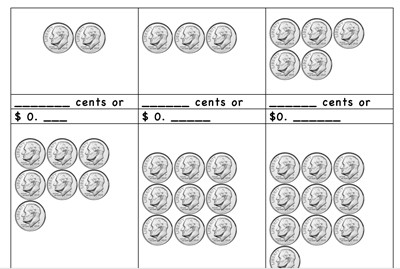
2.MD.D.9 - Tally Charts
Description: This activity requires students to answer questions associated with a tally chart.
2.MD.D.9 - Tally Charts - Printable
Description: This activity requires students to answer questions associated with a tally chart.
1.MD.C.4 Grade 1 Common Core - Introduction to Reading Bar Graphs - Printable
Description: This activity requires students to read basic bar graphs to answer questions about data.

Bar Graphs and Variations on the Y-Axis- Online
Description: This activity requires students to read and make calculations based on a bar graphs with y-axis intervals of ten or more. Immediate feedback is provided.
2.MD.D.10 -Bar Graphs: The Number of Siblings Per Student in a Classroom
Description: This activity requires students to read data from a bar graph to answer questions about the number of siblings per student in a fictional classroom.

Continuing with Bar Graphs - Grade 3
Description: This activity requires students in grades 3 or 4 to answer questions about various bar graphs. It gives immediate feedback.

Fractions and Bar Graphs - Online
Description: This activity will requires students to read fraction data from a bar graph.

Fractions and Bar Graphs Version 2 - Online
Description: This activity will requires students to read fraction data from a bar graph.

Fractions and Line Graphs - Online
Description: This activity will requires students to read fraction data from a line graph.

Baseball Card Math - Jackie Robinson - Reading Line Graphs
Description: Baseball Card Math is an activity in which students must make calculations and conclusions based on a player's statistics (listed on the back of a baseball card). This particular example reinforces drawing conclusions and reading statistics from line graphs.

Reading a Line Graph - Online
Description: This activity requires students to answer questions based on line graphs. It gives immediate feedback

Line Graphs with Fractions - Online
Description: This activity requires students to answer questions based on line graphs with fractions. It gives immediate feedback

Histomatics - Using Civil War Battles Data to Make a Box And Whisker Plot
Description: This activity walks students through the process of making a Box and Whisker plot on a step-by-step basis. Then, it requires students to use a chart that describes the number of major Civil War battles in each state, to make a box and whisker plot.

Histomatics - Using Civil War-era State Populations to Make a Histogram
Description: This activity walks students through the process of making a Histogram on a step-by-step basis. Then, it requires students to use a chart that describes the population of each state during the Civil War, to make a histogram.
Advertisement