Advertisement
Graph Generators
This section includes programs that can generate different kinds of graphs based on data entered.
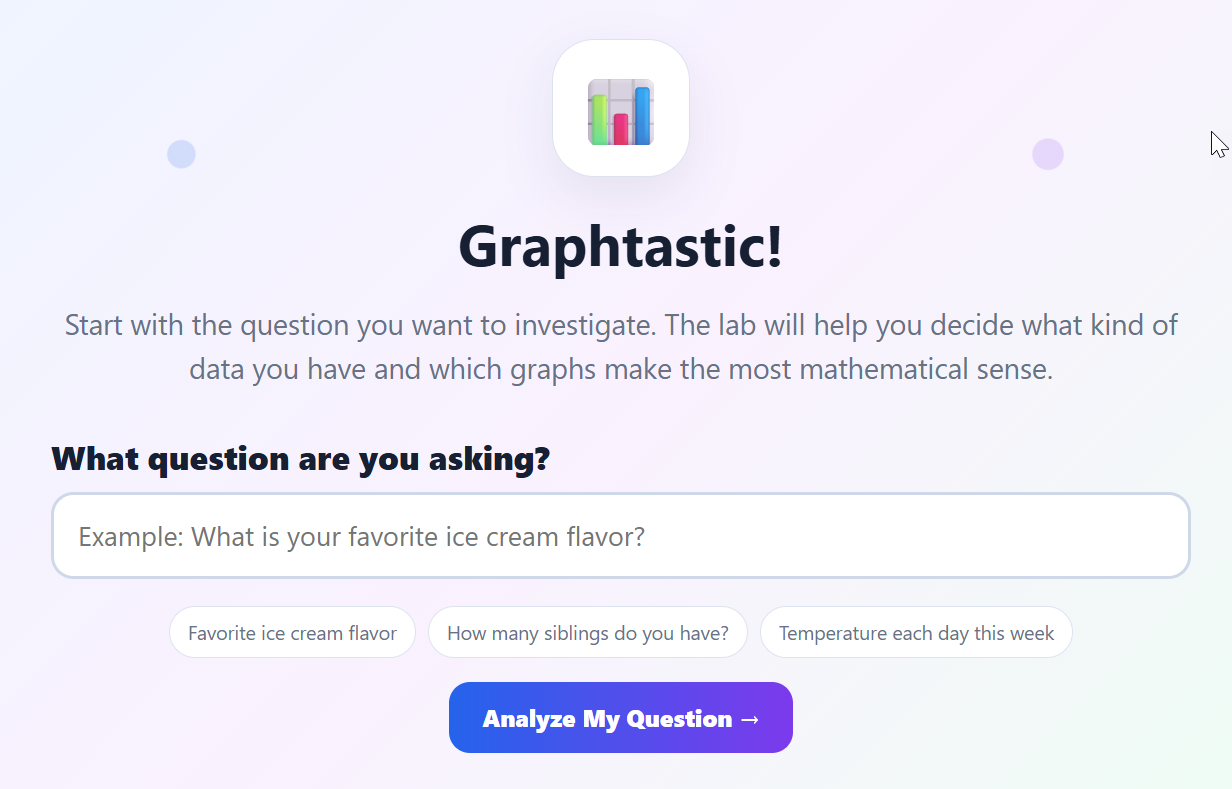
Graphtastic - Graphing Workshop
Description: Graphtastic! is an interactive graphing tool that helps students turn real survey data into colorful, easy-to-read graphs. Students choose the type of data they are collecting, enter their results, create the most appropriate graphs, and answer automatically generated questions that build graph-reading and data-analysis skills.
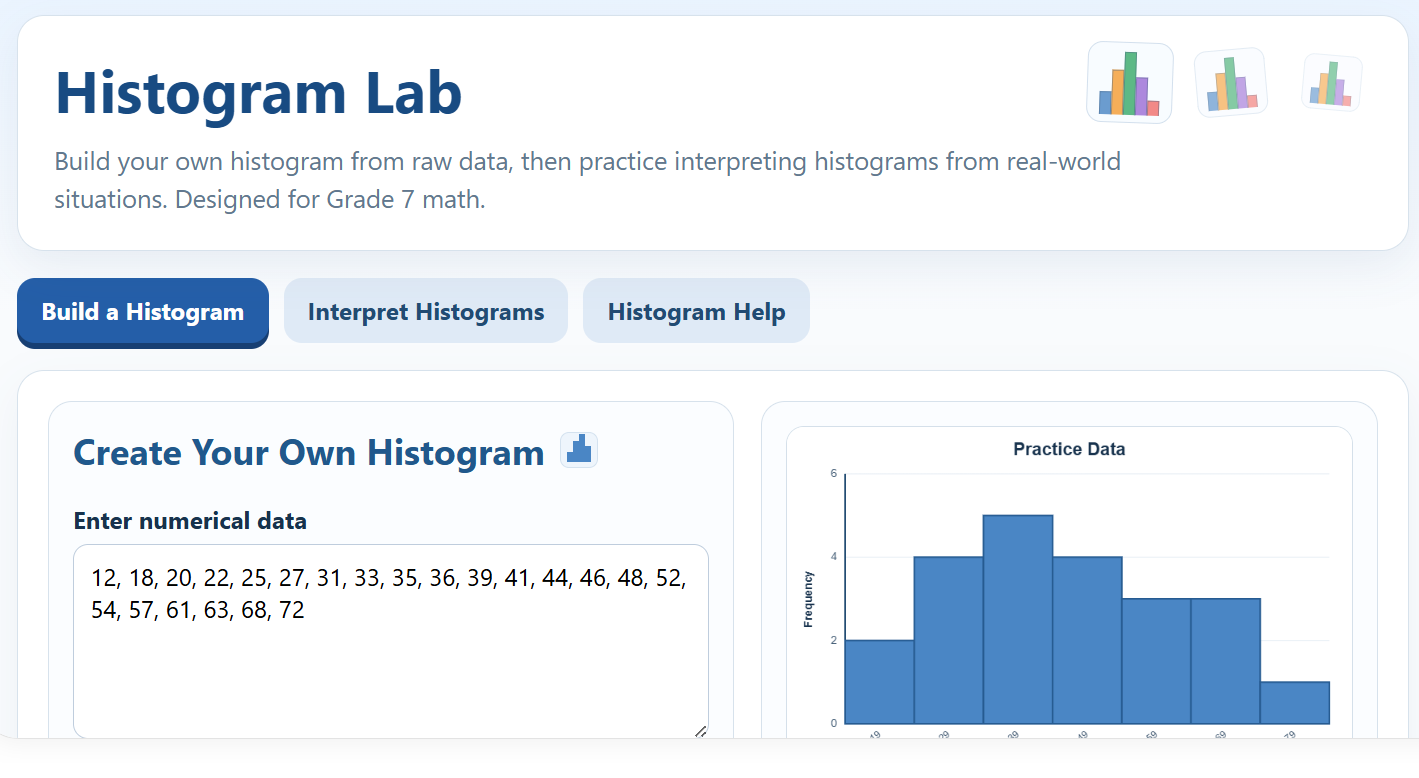
Histogram Lab
Description: Histogram Lab is an interactive Grade 7 math activity that helps students build, read, and interpret histograms. Students can create and print their own histograms using custom data or complete engaging 10-question challenges featuring real-world data. Questions include interpreting intervals and frequencies, identifying statements that must be true, and selecting the histogram that correctly represents a data set. Detailed score reports provide immediate feedback and help students identify skills that need more practice.
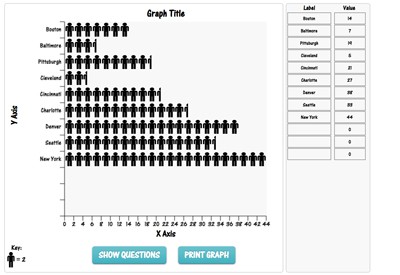
People Graph - Online Graphing Application
Description: People Graph is a polling tool that represents data visually with people icons. Take a poll of your classmates and then enter options and then the associated number of people who chose each option. Answer multiple choice questions generated by the program when completed. You can also print out your people graph. Change the X and Y axes and title by typing over the text already there.

Stem and Leaf Chart Generator - Online
Description: This is a simple stem and leaf chart generator. Students simply enter values and labels and print. Flash required.
Advertisement